With a large number of tokens from many projects about to be unlocked, investors are increasingly aware of the impact of fully diluted valuation (FDV) on price action. So what is FDV? How does it affect investing in the crypto market?

What is FDV?
Fully diluted valuation (FDV) is the market capitalization of a project when all tokens are unlocked and in circulation.
Example: The current market price of BTC is $66,695, and the total supply of BTC is 21,000,000. Therefore, the FDV of BTC = $66,695 * 21,000,000 = $1,400,246,463,000

Unlike market capitalization (market cap), which is the capitalization of the total circulating supply of a token, FDV represents the current valuation of the project in the market. However, due to the nature of only a small portion of tokens being in circulation and gradual unlocking in the future for most projects, the initial valuation is often inaccurate and subject to significant fluctuations over time.
Currently, with investors’ growing awareness of the negative impacts of unlocking large amounts of tokens, FDV is demonstrating its importance in price action. In the following sections, we will explore the role and influence of FDV, as well as how to use it as an effective investment tool.
The Role of FDV in the Crypto Market
Before being listed on exchanges, projects typically go through multiple funding rounds. In each round, they usually announce the amount of capital raised and the valuation. This is the FDV at the round in which the fund participates.

With market capitalization, when investors combine it with other information in the tokenomics, such as token allocation and token release schedule, it helps them calculate how many tokens an entity can currently sell.
With FDV, when investors combine this metric with tokenomics, they can calculate the value of the tokens an entity holds when they are fully unlocked. In other words, we can know whether investors are making a significant profit compared to their initial investment.
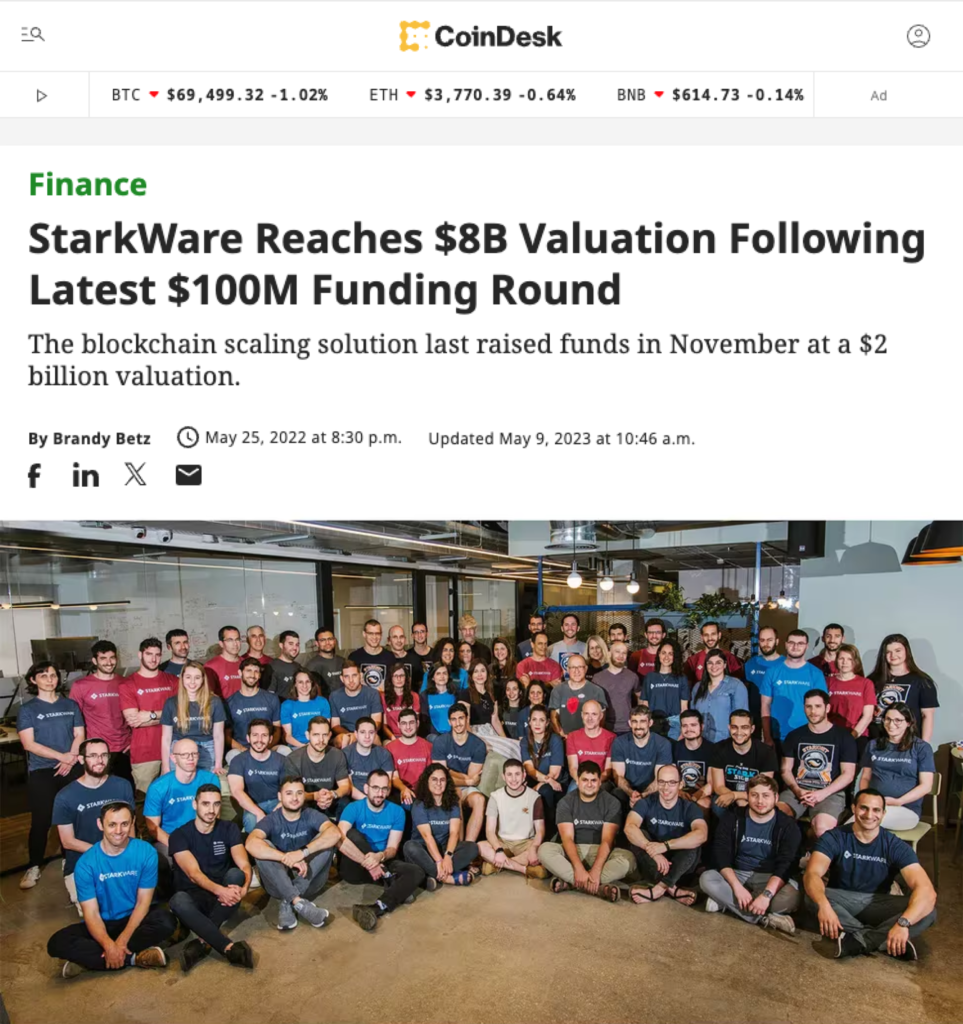
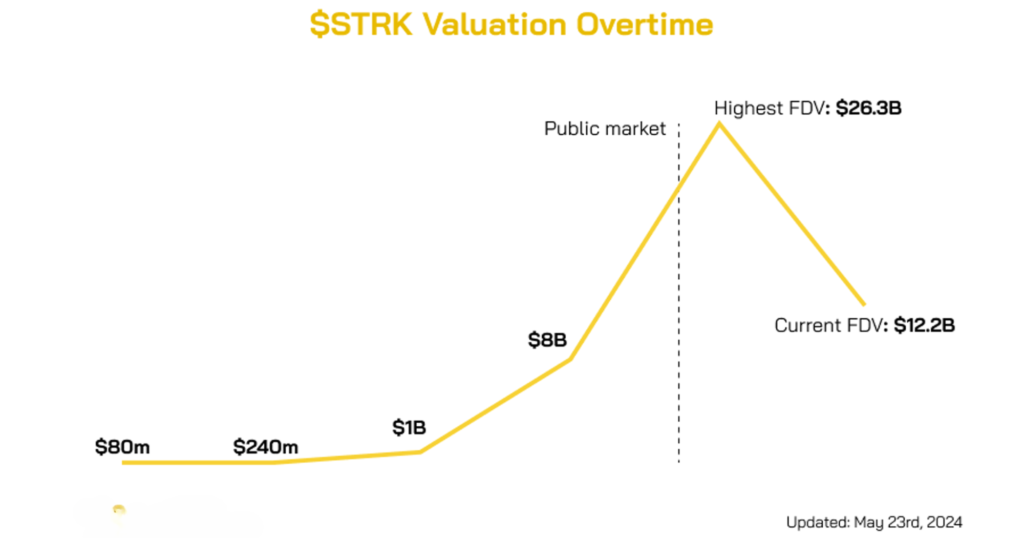
Example: $STRK raised capital in a seed round at $80m FDV, followed by funding rounds with valuations of $240m FDV, $1B FDV, and $8B FDV. (Information provided by Cobie)
With the current FDV of ~12.5B, we have a 156x return for the seed round, followed by 52x, 12.5x, and +56%.
Suppose you were an investor in the seed round of the STRK token, what would you do when your 156x investment starts to unlock?
Of course, that’s not the actual number investors receive. Due to the token unlock schedule, the number will vary based on price fluctuations at each unlock point.
Example: A VC invests in a project at a $400m FDV
In January, they receive 10% and sell at $1B FDV
In February, they receive 10% and sell at $2B FDV
In March, they receive 10% but can only sell at $200m FDV
…
In October, they receive the remaining 10% and sell at $400m FDV
In this case, the actual amount they receive will be the sum of the above sales, and the profit ratio is the total actual amount received divided by the initial investment.
From an investor’s perspective, they face the risk of token price fluctuations during unlocks. In addition, they also face reputational risks or have to wait a very long time before the token launch. Revisiting the example above, the seed round investors of $STRK invested in 2017, and it took 7 years until the unlock.
Understanding the FDV metric will help us:
- Estimate a reasonable valuation for investment.
- Gauge the sentiment of token holders.
- Combine with other information in the tokenomics to predict price action.
Trend of High FDV and Low Initial Circulating Supply
According to data compiled by Binance Research, the ratio of market capitalization to fully diluted valuation (MC/FDV) has decreased by about 50% each year. This decrease means that projects are only unlocking a small amount of tokens initially, and a large number of tokens will be unlocked in the future.

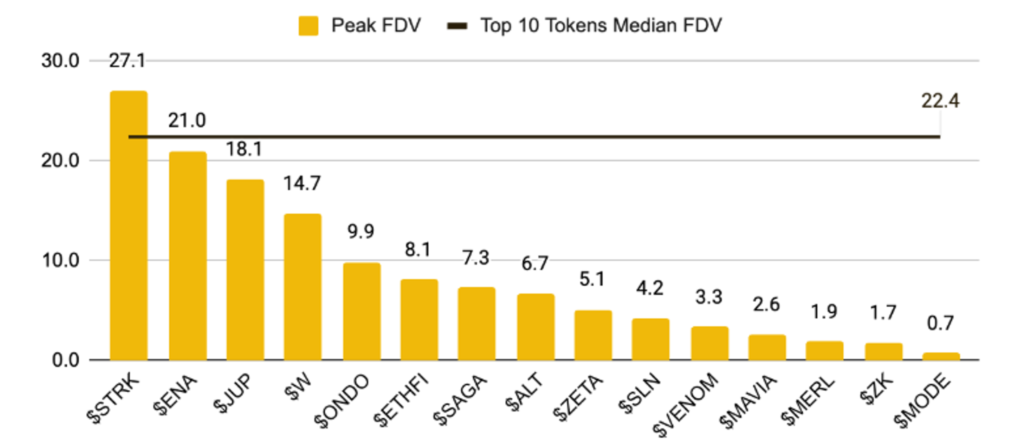
With a low initial circulating supply, the token price can increase sharply during the initial listing period. This causes the FDV of those projects to reach high levels comparable to the current top projects in the market

However, high initial growth often comes at the cost of long-term decline. Raising capital in multiple rounds before releasing the token to the public gives early investors high returns. When their tokens unlock, they tend to sell, which drives the price down. The greater the difference between MC/FDV and the higher the FDV, the stronger the future selling pressure will be.
Continuing with the example of Starknet, if we plot the valuation from the initial fundraising to the present, it would look like this

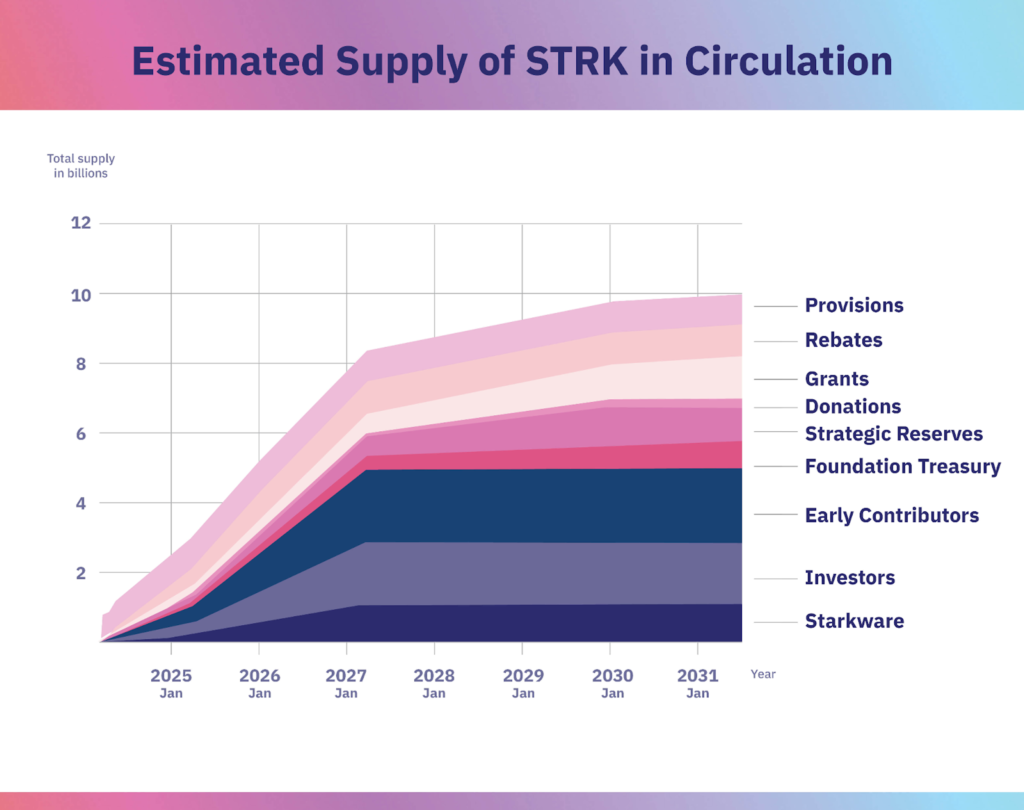
Combined with information from the token unlock schedule, we can see that the initial circulating supply was very small, only 7% of the total supply. The price of $STRK increased sharply in the early stages of growth. However, new tokens are unlocked every month. A portion of these tokens were purchased at low valuations, creating significant selling pressure for profit-taking, especially in the context of the Starknet ecosystem still being under development, with metrics like TVL and user numbers not yet comparable to other Layer 2s. As a result, after reaching a peak of $2.63, the price of $STRK has been steadily declining and currently sits at $1.22

STRK Tokenomics
Of course, token price action is influenced by many factors besides FDV. However, applying FDV as described above shows us the correlation between how much token holders have profited and how much they can sell at a given time with the token’s price action.
So, what is the effective way to use FDV in investing? The next part of the article will help you answer this question.
How to Use FDV Effectively in Investing
Understanding how to apply FDV and related factors can provide a more comprehensive view before investing.
How to Apply FDV When Investing in a Project
Crypto projects usually provide basic information such as fundraising valuation, amount of funds raised, and tokenomics. If projects do not disclose this information, it is a “red flag” regarding risk.
1/ Calculate the purchase price of the fund when knowing the valuation and total token supply
For example, $STRK raised capital at valuations of $80m, $240m, $1B, and $8B, and the total token supply of $STRK is 10 billion => The fund purchased $STRK at prices of $0.008, $0.024, $0.1, and $0.8/STRK, respectively.
Then, depending on the market price, investors can see the correlation between the current price and the fund’s purchase price. If the current price is too high compared to the price at which the fund purchased, while there is still a large amount of tokens waiting to be unlocked, investors should consider carefully before investing.
Conversely, if the current price is much lower than the price the fund purchased at, they are losing money on that investment round. In this case, the selling pressure will be lower.
2/ Predict price action when knowing the amount of capital raised
For a deeper analysis, when there is enough information about the amount of capital raised in each round, we can calculate the proportion of each round that the fund invested.
$STRK allocates 18.17% to investors, of which:
- Seed round raised $6m at a valuation of $80m => Purchased 750m $STRK (7.5% of total supply)
- Latest round raised $100m at a valuation of $8B >> Purchased 125m $STRK (1.25% of total supply)
- Two rounds at $240m and $1B are not yet disclosed but have a combined allocation of 9.42%
From the above information, we can see that the proportion of the seed round is very large. With a high proportion and huge profit compared to their invested capital, we can speculate on the price action when their tokens are unlocked after a long investment period.
It is important to note that the above information is often not complete. Projects usually only disclose information for some rounds or only have information about the amount of capital raised or the valuation. Depending on the information available to investors, we will be flexible in calculating and predicting price action when tokens are unlocked.
Other Factors Besides FDV
1/ Overview Information
FDV is only one of the factors to be analyzed when making investment decisions. When investors evaluate a project, factors such as product overview, development team, tokenomics, partners/investors also need to be grasped. This is also the method applied by Coin98 Insights in the Coin & Token section to help readers understand the project quickly and easily.
2/ Market Trend
“A rising tide lifts all boats.” The rise and fall of the market greatly affects the price fluctuations of tokens. When the market is in an uptrend, the growth in market capitalization (MC) of other projects in the same segment causes the remaining projects to grow as well. At this time, the influence of FDV is reduced when there are many buyers and token holders are not yet willing to sell.
When the market is in a downtrend or uncertain, token holders tend to sell as soon as the tokens are unlocked, causing the token price to drop sharply. At this time, FDV has a greater influence on price action.
3/ Influence from other types of transactions in the market
For example, the $STRK seed round was purchased at an $80m FDV, but they had to wait a long time while having a need to sell when they saw subsequent funding rounds valued at $1B, $8B. At this time, they will use OTC trading to sell their allocated tokens. The existence of a pre-token launch market affects not only the analysis of the investment price but also the token price when it goes public.
A high pre-market trading price will push the token price higher at launch, and vice versa. Investors should only consider the calculation of the purchase price through FDV as a reference tool and need to combine it with other factors to project a more appropriate valuation.
Example 1: For tokens that receive a lot of attention like STRK, OP, ARB, we should calculate the purchase price of the fund in the latest funding rounds and determine the entry point based on these rounds, not the first round.
Example 2: Thala (THL) did not receive as much attention as the projects mentioned above when it was first launched, but it has a stable foundation. After a while, the token price dropped below the purchase price in the Seed Round. Based on this price level, investors can calculate to make a decision.
4/ Analyzing other players at the table
Remember that it’s not just investment funds that hold tokens, but also many other entities. Analyze how many tokens each entity is unlocking and see if they have a tendency to sell tokens for any particular purpose. This factor has been analyzed in detail in the article: What is Tokenomics? An Open Game with Market Makers.
5/ Understand your own playing style
No matter how deep the analysis is, the most important thing is for investors to understand what playing style suits them. If you want to play short-term with high risk, you need to learn how to allocate capital and can choose projects with a low initial circulating supply. If you are comfortable with buying and holding for the long term, choose projects that are less affected by future unlocks. Understanding your playing style will help investors know the next steps to take and make appropriate reactions.
Conclusion
FDV is an important tool for calculating entry points and predicting price action. Knowing how to use FDV in conjunction with other important factors in the analysis will help investors have a more comprehensive and confident view when investing.
Read more: What is TVL? Why is TVL important in DeFi?
Read more: If you need a product to assist with tax issues and portfolio management in crypto, check out CoinLedger

