One of the platforms trusted by the vast majority of investors in crypto is DefiLlama. See the guide to using the common features of DefiLlama here.

What is DefiLlama?
DefiLlama is a website that aggregates data on dApps and blockchains, including metrics such as TVL, transaction fees, and revenue.
Currently, DefiLlama allows users to track data on over 2,400 protocols and 150 different blockchains. Most of DefiLlama’s data sources come from protocol APIs and aggregated sources from news sites.
Launched in 2022, DefiLlama is one of the most popular applications in the crypto market, with over 9 million visits per month (according to Similarweb).
Reasons to Use DefiLlama
In the crypto community, DefiLlama is used by the majority of retail investors and even celebrities for general purposes such as:
- Tracking project TVL and revenue: TVL and revenue are two relatively important metrics for a crypto project. TVL represents the total value of assets locked in the protocol, and revenue shows the profitability of the project. In general, the higher the TVL and revenue, the greater the potential and credibility of the platform.
- Tracking the ecosystem: Not just general parameters of the network, DefiLlama also supports users in tracking the list of dApps on each network. From there, it helps investors to evaluate and search for potential ecosystems and dApps.
- Airdrop hunting: Not as common as the two forms above, but DefiLlama is still trusted by some as an airdrop hunting tool in the crypto market.
While the above are the three main purposes that most investors use DefiLlama for, this platform still has many features to provide investors with all the parameters and information about the crypto market.
Overview of Common DefiLlama Functions
Below is a common feature used by most crypto investors:
Overview
Overview is the main interface of DefiLlama. This section allows users to track general parameters of the crypto market and networks, including:
- TVL: Total assets locked in the crypto market.
- Stablecoin market cap: Market capitalization of stablecoins.
- Trading volume in the last 24 hours.
- And some other indicators such as derivatives trading volume, the amount of capital raised…
The highlight of the Overview is that it not only displays data in numerical form but also in chart form, making it easy for users to track changes over time.
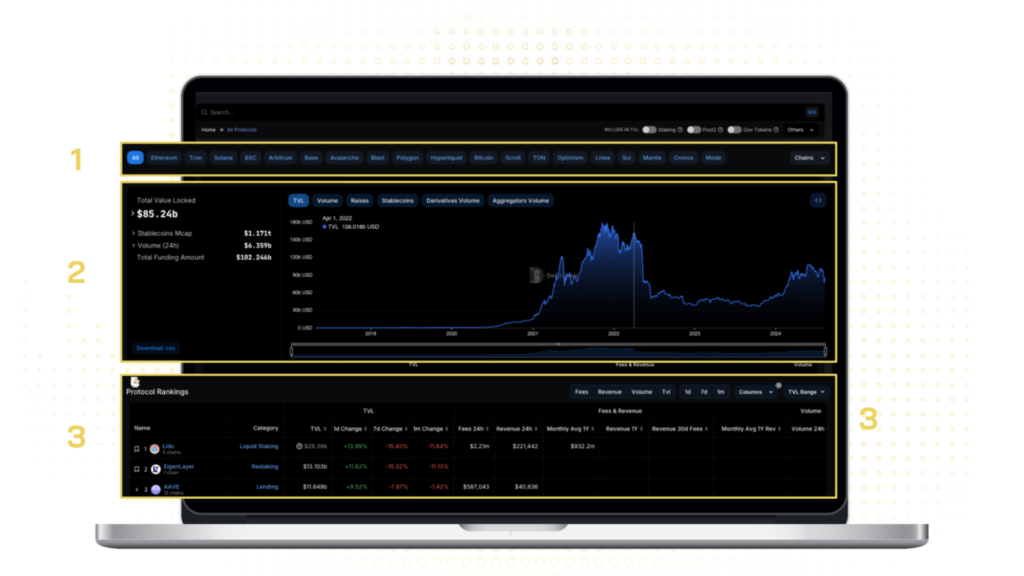
- This section displays the networks that DefiLlama supports. If the user selects “All,” DefiLlama will display the overall market parameters. If a specific network is chosen, DefiLlama will allow the user to view the metrics of that ecosystem.
- Line charts of network metrics. These metrics include TVL, trading volume, transaction fees, number of transactions, network revenue, etc.
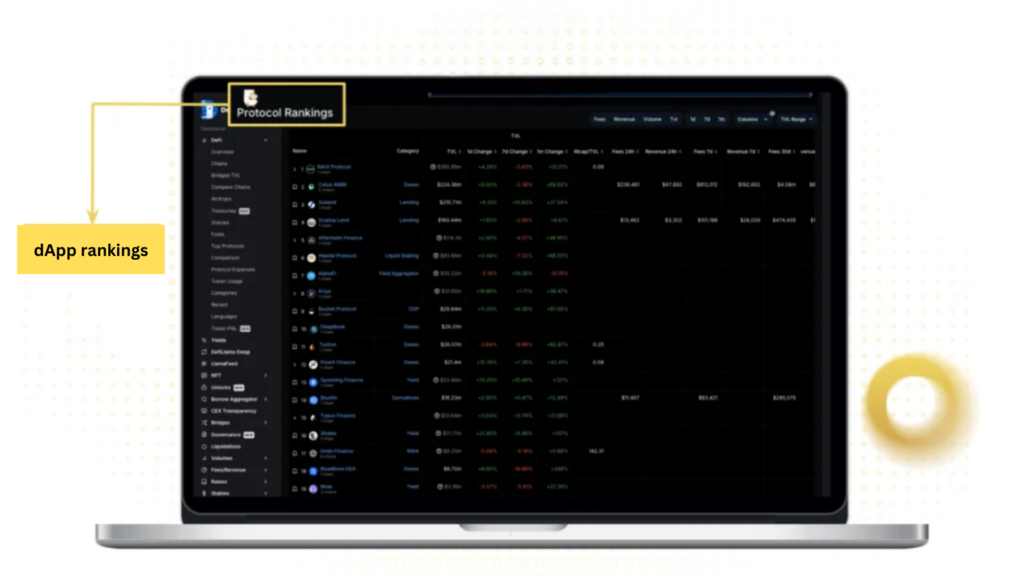
- Ranking of dApps by TVL on each network. In addition to the TVL metric, this table also lists the TVL volatility, daily transaction fees, daily revenue, and the dApp’s category.
This is also the main interface for users to track TVL and revenue. Below are the steps for users to track a project’s TVL and revenue:
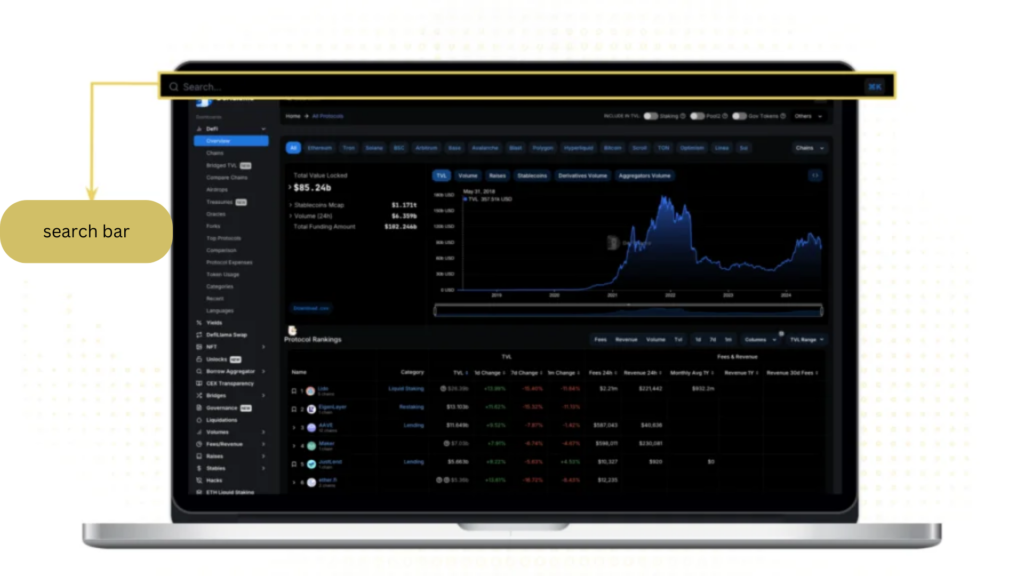
Step 1: On the homepage interface, users select the Search toolbar and enter the name of the project they want to find. In this article, we will take Uniswap as an example
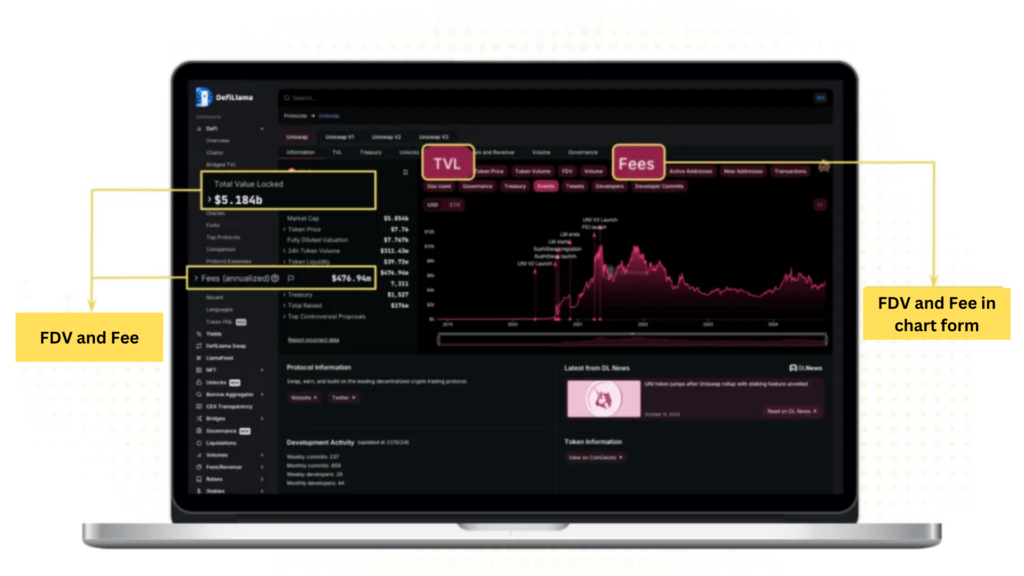
Step 2: Here, users can track the TVL and revenue parameters in the left corner of the screen. To track in chart form, users select “TVL” and “Revenue.”
If DefiLlama does not display the project’s revenue, users can select “Fees” (transaction fees) to display revenue data. From the revenue, users can project the protocol’s profit.
Taking Uniswap as an example, DefiLlama does not display profit, but it does show the platform’s transaction fees. From here, users can calculate revenue by multiplying the transaction fees by 0.05%, as Uniswap charges a 0.05% platform fee on total transaction fees. The calculation method varies depending on the project.
Chains
Chains is a section that compares the TVL of networks in the form of a pie chart. In the Chains section, users can compare each network “segment”, such as EVM, non-EVM, Rollup, Cosmos networks
In addition to TVL, the Chains section also displays stablecoin capitalization on each network, transaction fees, number of dApps, revenue…
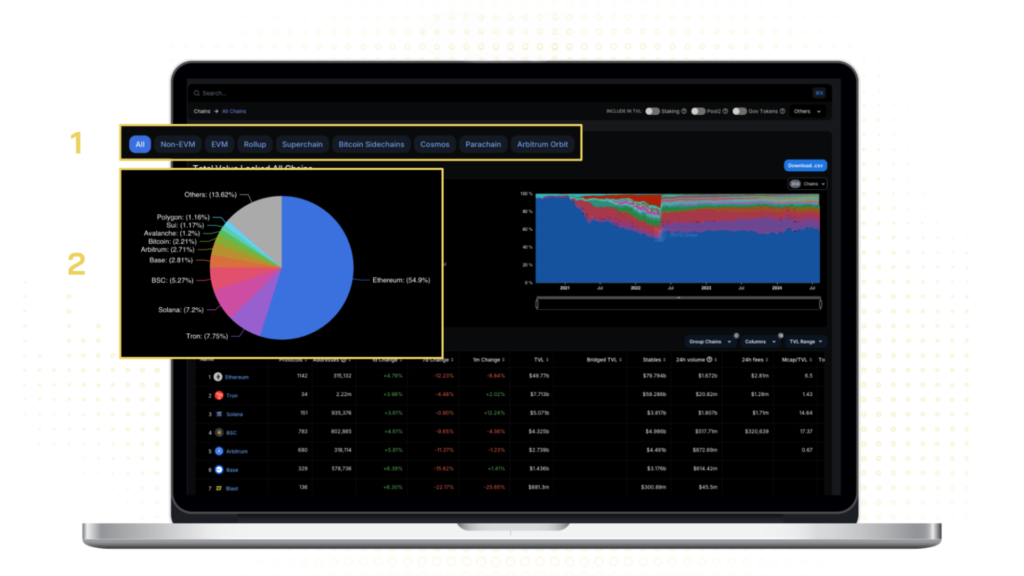
- This section allows users to filter networks. The information and charts will change based on the user’s selection.
- Pie chart comparing TVL across different networks.
To track the ecosystem on each network, users can perform the following steps:
Step 1: In the DeFi category, users select “Chains” and choose the ecosystem they want to view. Alternatively, users can use the Search toolbar to find the ecosystem.
In this article, we will select the Sui network.
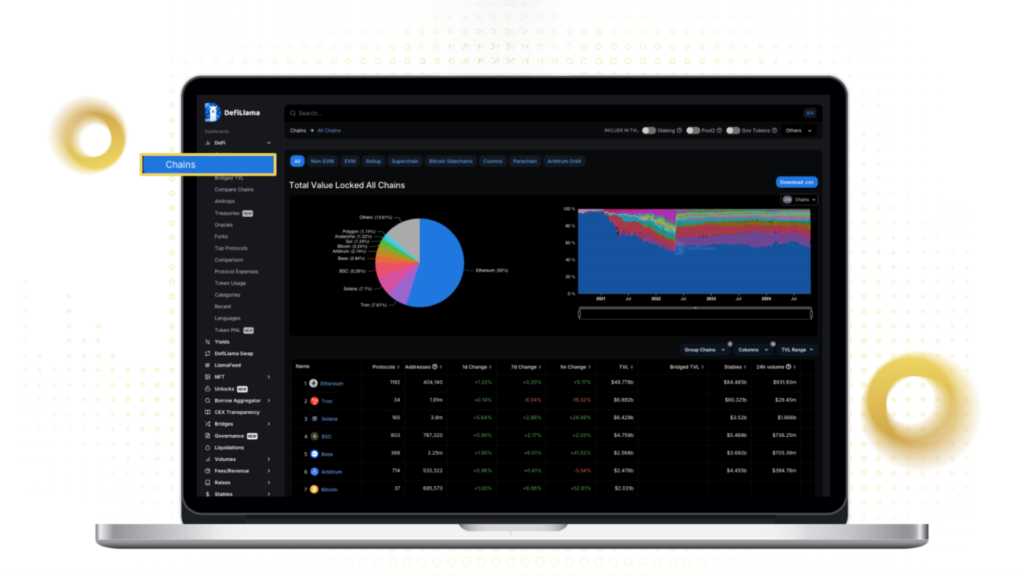
Step 2: DefiLlama will then display the list of dApps on Sui, ranked by TVL. From here, users can use this list to evaluate the network’s ecosystem.
For Sui, Lending/Borrowing projects account for a large proportion of TVL, including Navi Protocol, Suilend, and Scallop. Meanwhile, DEXs dominate in terms of the number of projects, with over 12 different projects, the most prominent being Cetus.
Also, compared to other ecosystems like Optimism and Arbitrum, the total TVL on Sui is relatively large, but the number of projects is relatively small and disproportionate to the TVL.
Note: Although DefiLlama is frequently used to track ecosystems, this platform still does not display the complete number of projects. Therefore, users should be selective and combine it with other platforms to have the most comprehensive view.
Bridge TVL
Bridge TVL is a section that displays the ranking of bridges in the market. The purpose of Bridge TVL is to allow investors to easily identify the most used bridges in recent times and thereby forecast which ecosystems are benefiting. For example, if the Avalanche bridge has the highest volatility in the past 24 hours, it is likely that the Avalanche ecosystem is experiencing an inflow of capital.
Below are the parameters displayed in the Bridge TVL section:
- Total Bridged: The total value locked (TVL) in the bridge.
- Change 24h: The 24-hour volatility of the trading volume on the bridge.
- Native: The amount of native assets from other networks using the bridge. For example, ETH is the native token on Ethereum; when using the Optimism bridge, it will be converted to OPETH.
- Canonical: The amount of native assets on the network using the bridge. For example, USDC is the native token on both Ethereum and Optimism; when using the Optimism bridge, it will remain as USDC, instead of a wrapped token version like OPETH.
- Own Tokens: The amount of native tokens of the network that have used the bridge.

Compare Chains
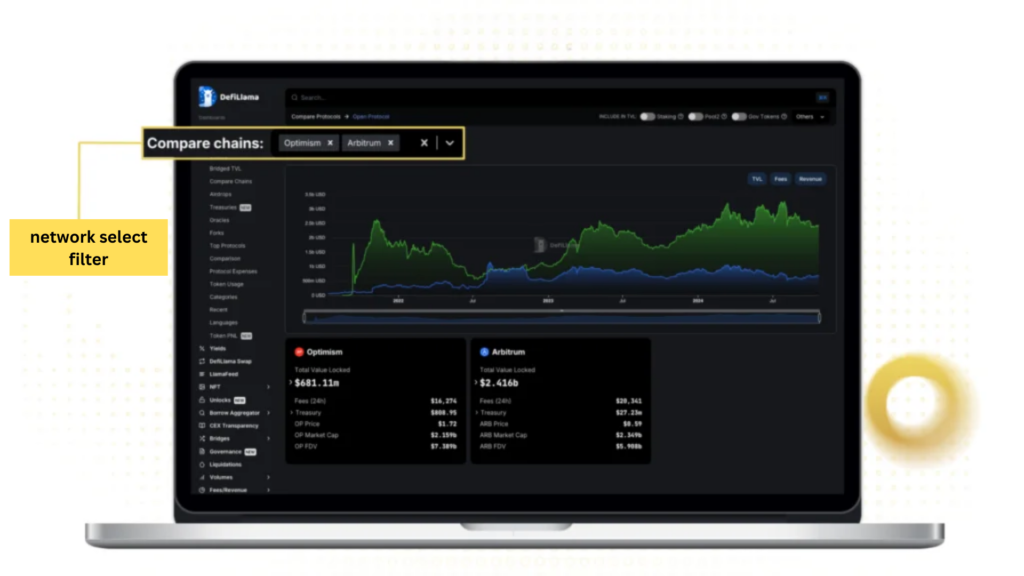
Compare Chains is a function that helps users compare the parameters of each network in the form of a line chart. These parameters include TVL, network fees, revenue, token capitalization, and more.
Airdrop
This is a section showing dApps that have airdrop potential in the future. At DefiLlama, the platform arranges dApp airdrops based on the platform’s TVL number. The higher the TVL, the higher the airdrop potential for users.
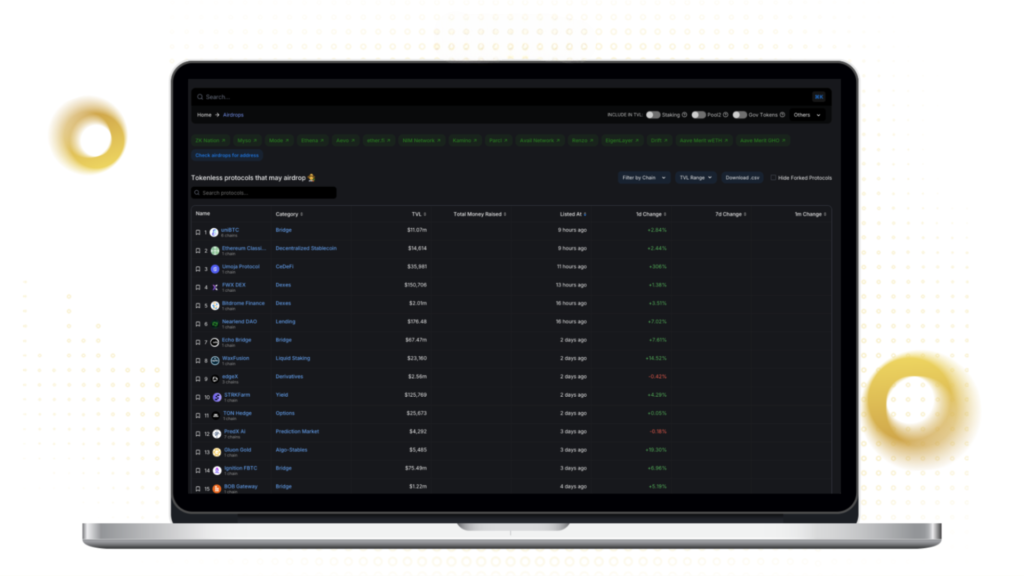
Below is a step-by-step guide to airdrop hunting on DefiLlama:
Step 1: First, users select Airdrops.

Step 2: On the Airdrops interface, DefiLlama will display protocols that do not yet have a token, which may have an airdrop in the future.
However, users should note that DefiLlama still has some errors in the Airdrops section. These errors include:
- Displaying some projects that have had an airdrop recently, such as EigenLayer, Swell…
- Displaying projects that will definitely not have an airdrop, such as the Binance and Bitcoin bridge – Binance Bridge…
Therefore, when using this feature, users need to carefully select projects before deciding to hunt for airdrops. In addition, when hunting for airdrops on DefiLlama, users should pay attention to the TVL index displayed on DefiLlama.
Treasuries
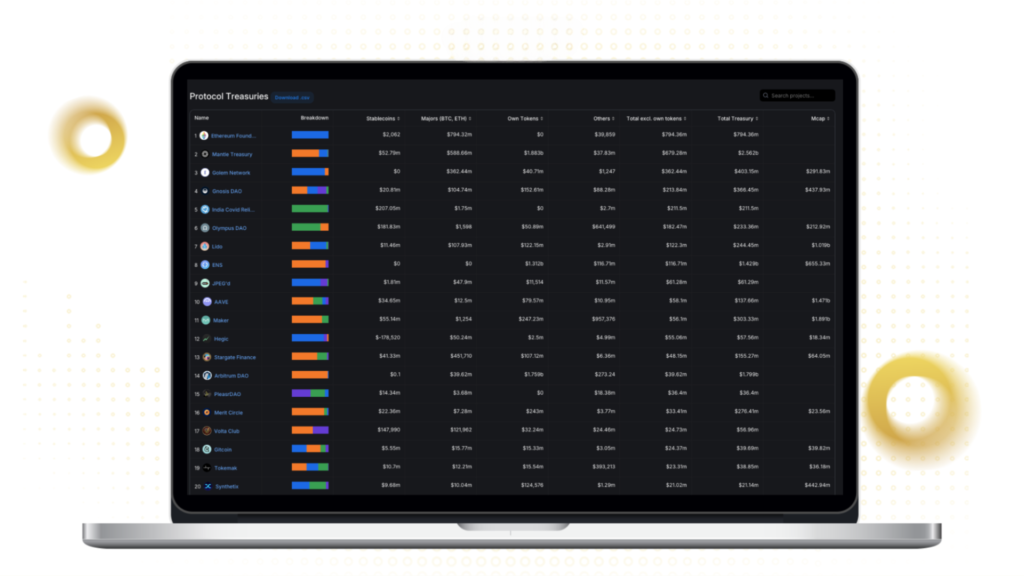
Treasuries is a section that shows the amount of assets held by projects. High Treasury values mean that these projects have the financial potential to develop their ecosystems in the future.
Currently, in the DefiLlama Treasuries section, these parameters include:
- Stablecoin: The amount of stablecoins held by the project team.
- Major (BTC, ETH): The amount of BTC and ETH tokens held by the team.
- Own token: The number of tokens held by the project itself. For example, the Ethereum Foundation will display the number of ETH held, Mantle Treasuries will reserve MNT tokens…
- Total excl. own token: The number of assets held excluding the “Own token” portion.
- Total Treasury: The total amount of assets held, including the project’s own token
Oracles
Oracles is a feature that compares Oracle projects in the crypto market. On DefiLlama, the comparison between Oracles is based on the TVS metric (Total Value Secured, representing the total value of assets that the Oracle protects). In addition to TVS, this section also displays the projects and networks that the Oracle is integrated with.

Forks
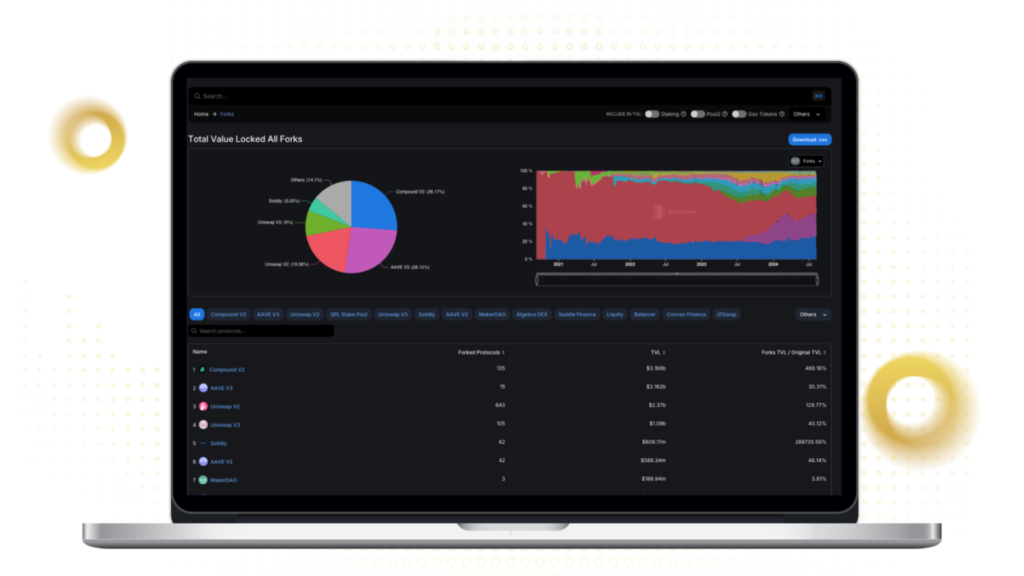
This section shows prominent projects in the crypto market that are often forked by other projects. For example, Uniswap is the largest DEX protocol in the crypto market, and there are always other projects imitating Uniswap based on their source code.
Accordingly, on DefiLlama, the Forks section displays the number of forked projects, the total TVL of the forked projects, and the ratio of TVL between the original project and its forks (Forks TVL / Original TVL).
Top Protocols
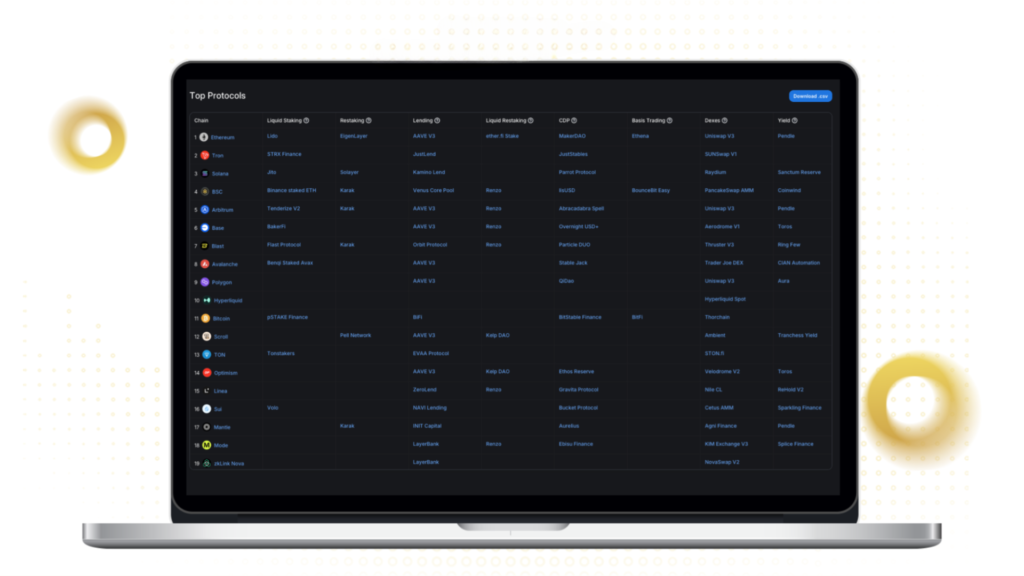
This section provides statistics on the leading protocols in each network. For example, DefiLlama shows that the Ethereum network has Lido leading in the Liquid Staking category, EigenLayer leading the Restaking niche, etc.
Currently, the platform supports nearly 305 ecosystems with 41 protocol categories.
Comparison
Comparison is a section that compares protocols and dApps in the crypto market. This feature is similar to Compare Chains

Protocol Expenses
Protocol Expenses is a section that lists the operating costs of protocols. However, this DefiLlama feature currently only displays 15 different protocols, a very small number in the crypto market.

Token Usage
This section allows users to track the number of tokens being used in each protocol. For example, the ETH token is mostly being used in the dApps Lido and EigenLayer.
Currently, DefiLlama supports over 117 different tokens across 300 networks.

Categories
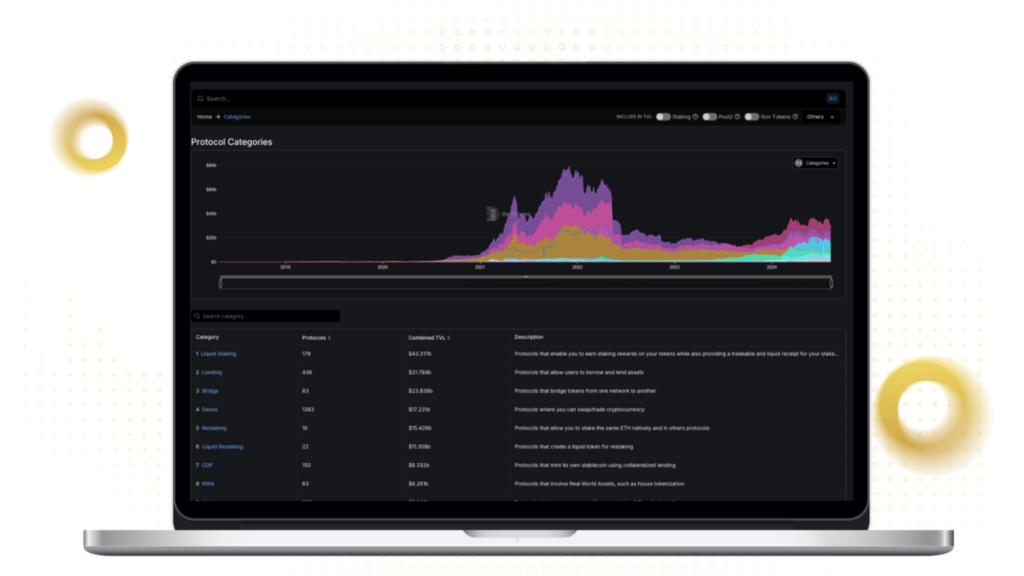
Categories is a section that allows users to track the most popular and capital-attracting niches in the crypto market. At the time of writing, the Liquid Staking niche is leading the market with 180 different protocols and a TVL of nearly $40 billion.
Yield
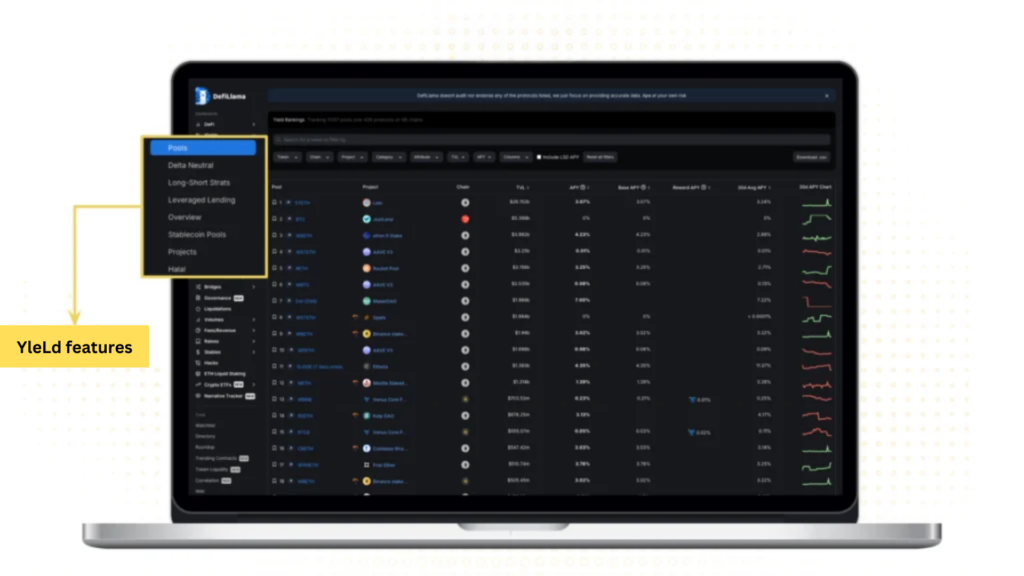
Yield is a section that displays yield sources in the crypto market. It not only helps find suitable yield sources for a specific token but also helps users find protocols that have not yet conducted an airdrop. Here are the 7 main features in the Yield section:
- Pools: A leaderboard of smart contracts that are being used by many people, led by Lido’s stETH with a TVL of $24 billion.
- Delta Neutral: This section allows users to find “paths” to earn stable profits, where the total farming assets are not affected by market fluctuations.
- Long-Short Strats: This section helps users find Long/Short products with stable profits and low funding fees.
- Leverage Farming: Displays farming platforms that incorporate leverage.
- Stablecoin Pools: Displays farming platforms that utilize stablecoins.
The DefiLlama Project Team
The team behind DefiLlama is Llama Corp, a company with well-known names like Chainlist, DL News, and LlamaNodes. They include:
- Charlie: Co-founder of DefiLlama. However, information regarding Charlie is almost non-existent online, except for the X account @0xLlam4.
- 0xngmi: Co-founder of DefiLlama. Similar to Charlie, information about him is not widely available on social networks. His X account is @0xngmi.
Similar Projects
- Arkham: A platform that provides on-chain activity data for major entities in the crypto market. Arkham was the 32nd project listed on Binance Launchpool.
- DeBank: A multifunctional management platform in the Web3 space, allowing users to track portfolios, on-chain activities, manage wallets, and more.

